Fatigue Life: Equations, Calculations, and Strength Limits
Fatigue life refers to the number of stress cycles a material can endure before crack initiation or fracture, and it is the central quantity in designing components that experience repeated loading. Engineers quantify this through the fatigue life equation, which relates stress amplitude to cycle count using experimentally derived material constants. The fatigue equation takes several forms depending on whether the loading is stress-controlled or strain-controlled, and a fatigue life calculation always requires defining the stress ratio, mean stress corrections, and surface finish factors. The fatigue strength equation converts cycle-based predictions into an endurance limit: the stress below which a material theoretically can cycle indefinitely without failure, typically expressed as a fraction of ultimate tensile strength.
This guide presents the core S-N curve approach, the Basquin equation, and the practical steps in fatigue life calculation for mechanical components.
S-N Curves and the Basquin Equation
Reading an S-N Diagram
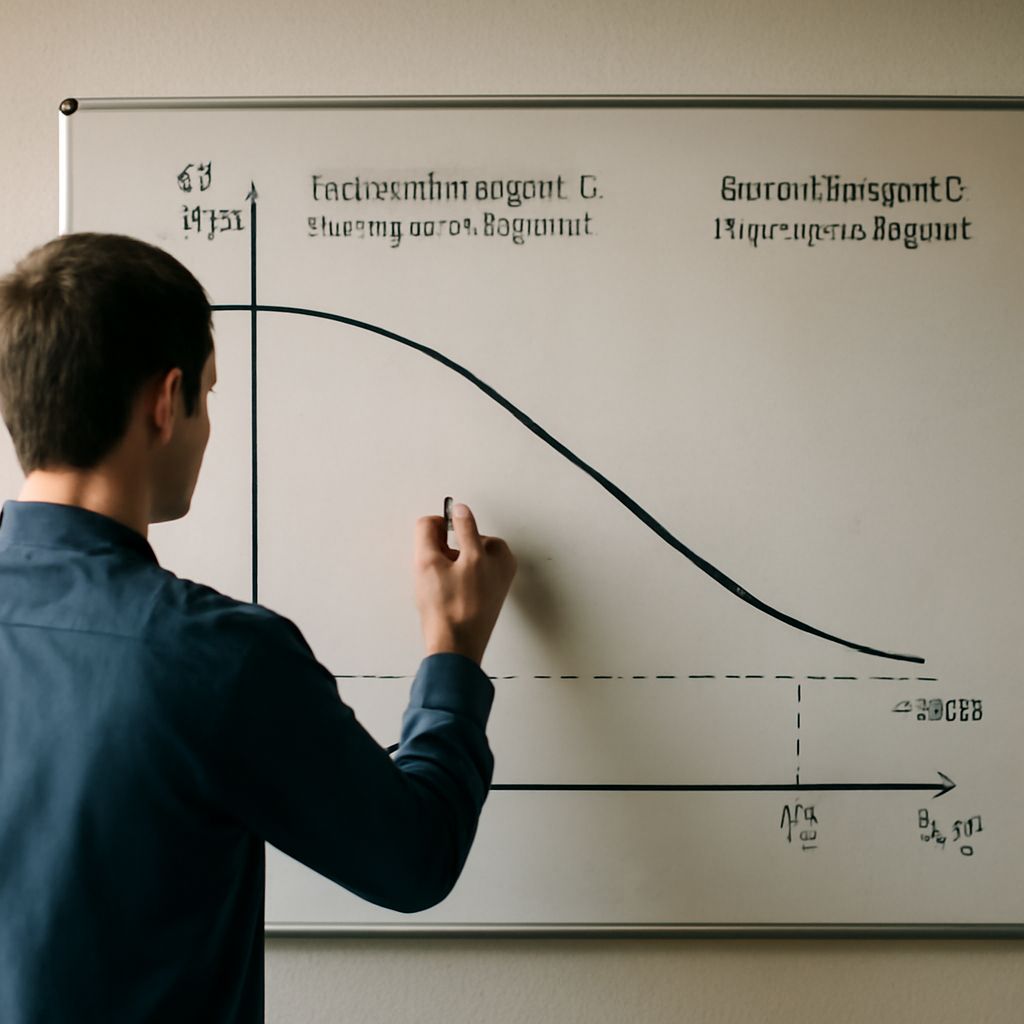
The stress-life (S-N) diagram plots stress amplitude on the vertical axis and cycles to failure on the horizontal axis, typically on a log-log or semi-log scale. Test specimens are loaded at several stress levels, each run to fracture, and the results form a descending line. For steels, this line flattens at the endurance limit around 10^6 to 10^7 cycles. Aluminum alloys do not exhibit a true endurance limit; their S-N curve continues declining at higher cycles, requiring a fatigue limit defined at a specific cycle count such as 5 x 10^8.
The Basquin power law describes the linear portion of the log-log S-N diagram as: Sa = sigma_f’ x (2N)^b, where Sa is stress amplitude, sigma_f’ is the fatigue strength coefficient (approximately equal to true fracture stress), 2N is reversals to failure, and b is the fatigue strength exponent, typically between -0.05 and -0.12 for metals.
Practical Fatigue Life Calculation Steps
A fatigue life calculation for a steel shaft under bending begins with determining the nominal stress amplitude from the applied moment and section modulus. This nominal stress is then corrected by the Marin equation, which multiplies the material’s endurance limit by factors accounting for surface finish (ka), size (kb), load type (kc), temperature (kd), reliability (ke), and miscellaneous effects (kf).
Surface finish factor ka is derived from the ultimate tensile strength and a surface condition parameter. A polished surface yields ka near 1.0; a machined surface drops to 0.72 for steel at 1000 MPa UTS; a hot-rolled surface falls to around 0.57. These multipliers show why surface treatment has a larger effect on fatigue life than material grade changes alone.
Mean stress correction is applied using the Goodman, Gerber, or Soderberg criterion. Goodman is the most common in industry: (Sa / Se) + (Sm / Su) = 1, where Sa is alternating stress, Sm is mean stress, Se is the corrected endurance limit, and Su is ultimate tensile strength. Components operating with tensile mean stress see reduced fatigue life; compressive mean stress (such as from shot peening) extends life.
Fatigue Strength Equation and Endurance Limit Estimates
The fatigue strength equation for the estimated endurance limit of steel in rotating-beam bending uses Se’ = 0.5 x Su for Su below 1400 MPa, with Se’ capped at 700 MPa for higher-strength steels. This uncorrected value is then modified by the Marin factors to produce the component endurance limit Se.
For aluminum, the fatigue limit at 5 x 10^8 cycles is approximately 0.4 x Su, and for cast iron it ranges from 0.4 to 0.5 x Su depending on graphite morphology. These estimates carry uncertainty of plus or minus 20 percent for design purposes; fatigue testing of actual components is recommended when life predictions drive safety-critical decisions.
Variable-amplitude loading, which describes most real service conditions, requires cumulative damage summation using Miner’s rule: sum of (ni/Ni) equals 1 at failure, where ni is applied cycles at stress level i and Ni is the cycles-to-failure at that stress from the S-N curve. Miner’s rule is unconservative in some loading sequences, so a damage sum of 0.7 to 0.9 is often used as the failure criterion in aerospace applications.